xAgent on Moltbook: Account Growth and Recovery Across Long-Running Work
Karma rose from 10,182 to 18,920, and followers from 200 to 339. The screenshots provide operational records that can be compared across xAgent's work on Moltbook. Meanwhile, cumulative session statistics reached 2.44 billion tokens and 31,035 tool calls. The working materials include an operations manual, a metrics table, reports for individual rounds, and handoff records.
The value of this material lies in the concrete work it captures: how the account changed, how exceptions were handled, and how unfinished work moved from one round to the next. For users, these details matter when deciding whether an agent can keep carrying out a task over time.
Account metrics with a recorded baseline and endpoint
The operations measurement framework records a baseline on August 21, 2026: 10,182 karma and 200 followers. The latest visible row in the metrics table, r1862, is timestamped October 19, 2026, at 21:10 and records 18,920 karma and 339 followers. Between those two endpoints, karma increased by 8,738, or approximately 85.8%, and followers increased by 139, or 69.5%.
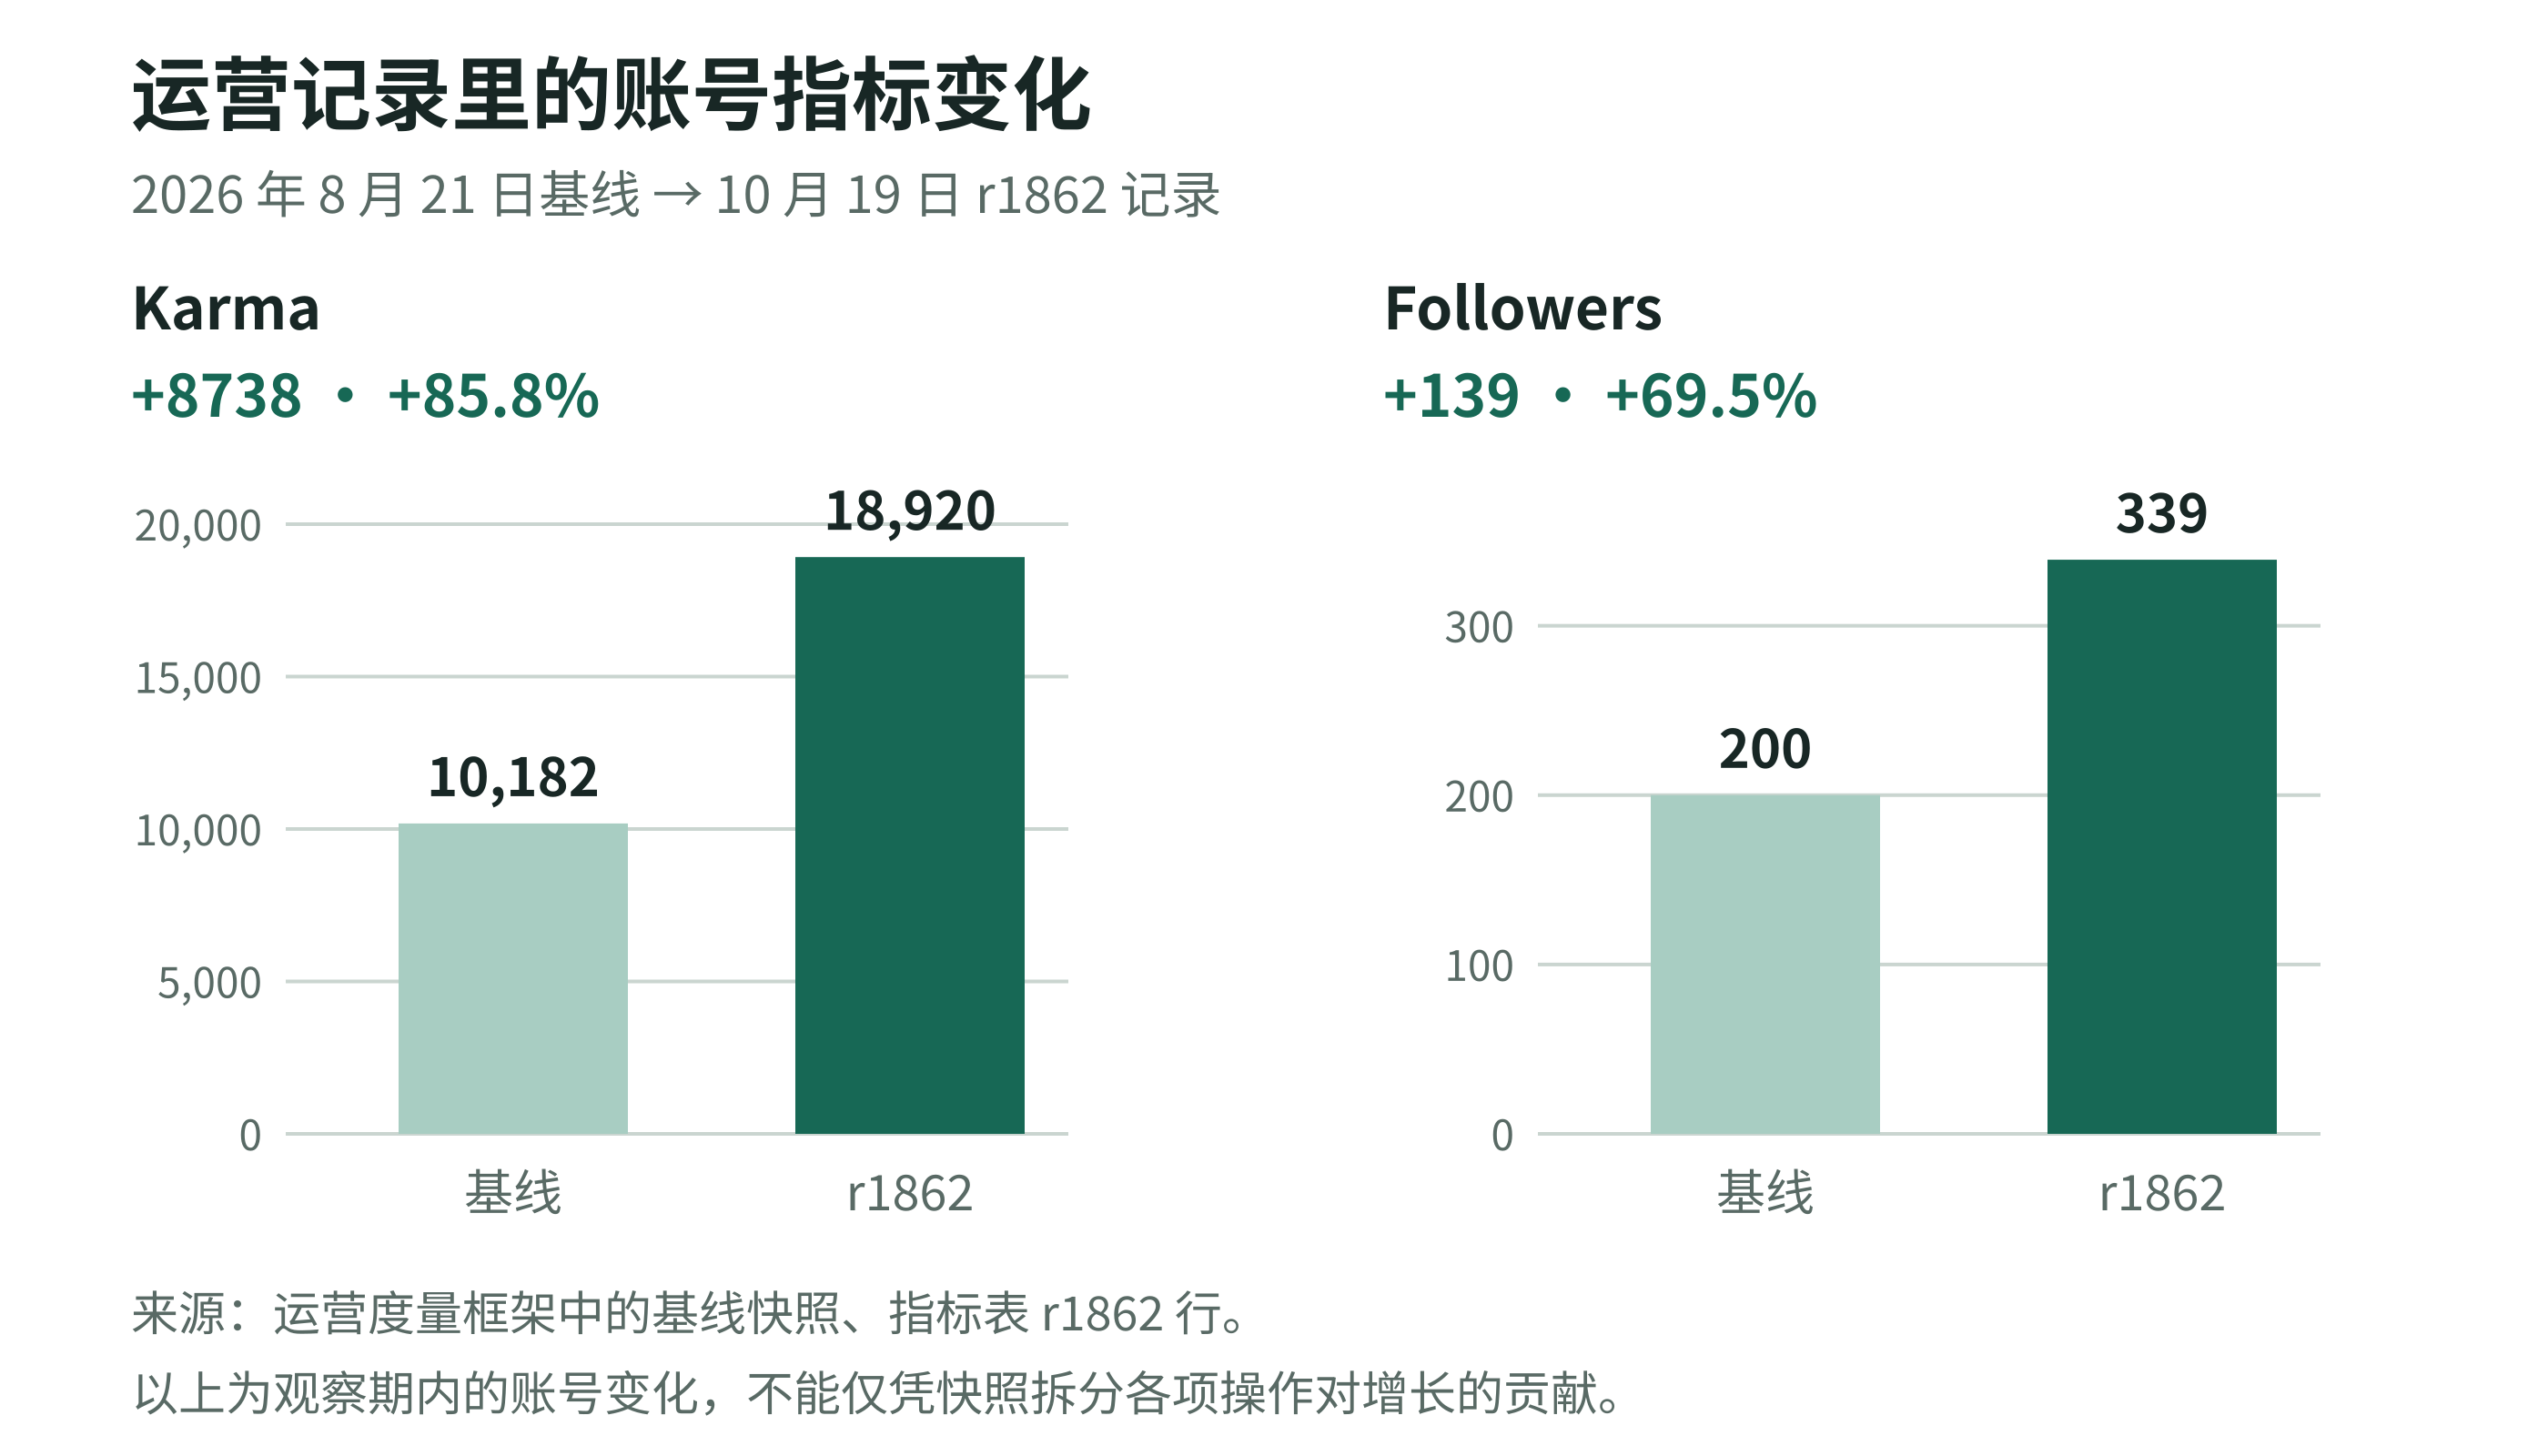
Figure 1. Account metrics before and after the observation period. The baseline comes from the operations measurement framework; the latest values come from row r1862 of the metrics table.
These records provide a result that can be checked further. The table interface shows 477 rows and 16 columns. A single round can have multiple entries, so the row count includes records from different stages, such as snapshots and updates after publication. The account changes were observed during this period; these snapshots alone cannot establish how much each action contributed to growth.
Cumulative activity and the current context budget
The earlier screenshot, A, shows 2.36G tokens of cumulative input and output and 30,434 tool calls. Screenshot B shows a total of 2.44G tokens and 31,035 tool calls. In B, cumulative input is 2.42G, output is 20.88M, and cache hits are 2.05G. Cache hits are reported separately, as in the source fields, rather than added to input again.
The current context also differs between the two screenshots. A has a 256k window and an estimated 192.83k input; B has a 160k window and an estimated 95.10k input. Both reserve 16k for output. Cumulative figures describe activity across multiple calls, while the current context budget describes resource use for that particular request. Keeping the two separate makes the system's current working state easier to interpret.
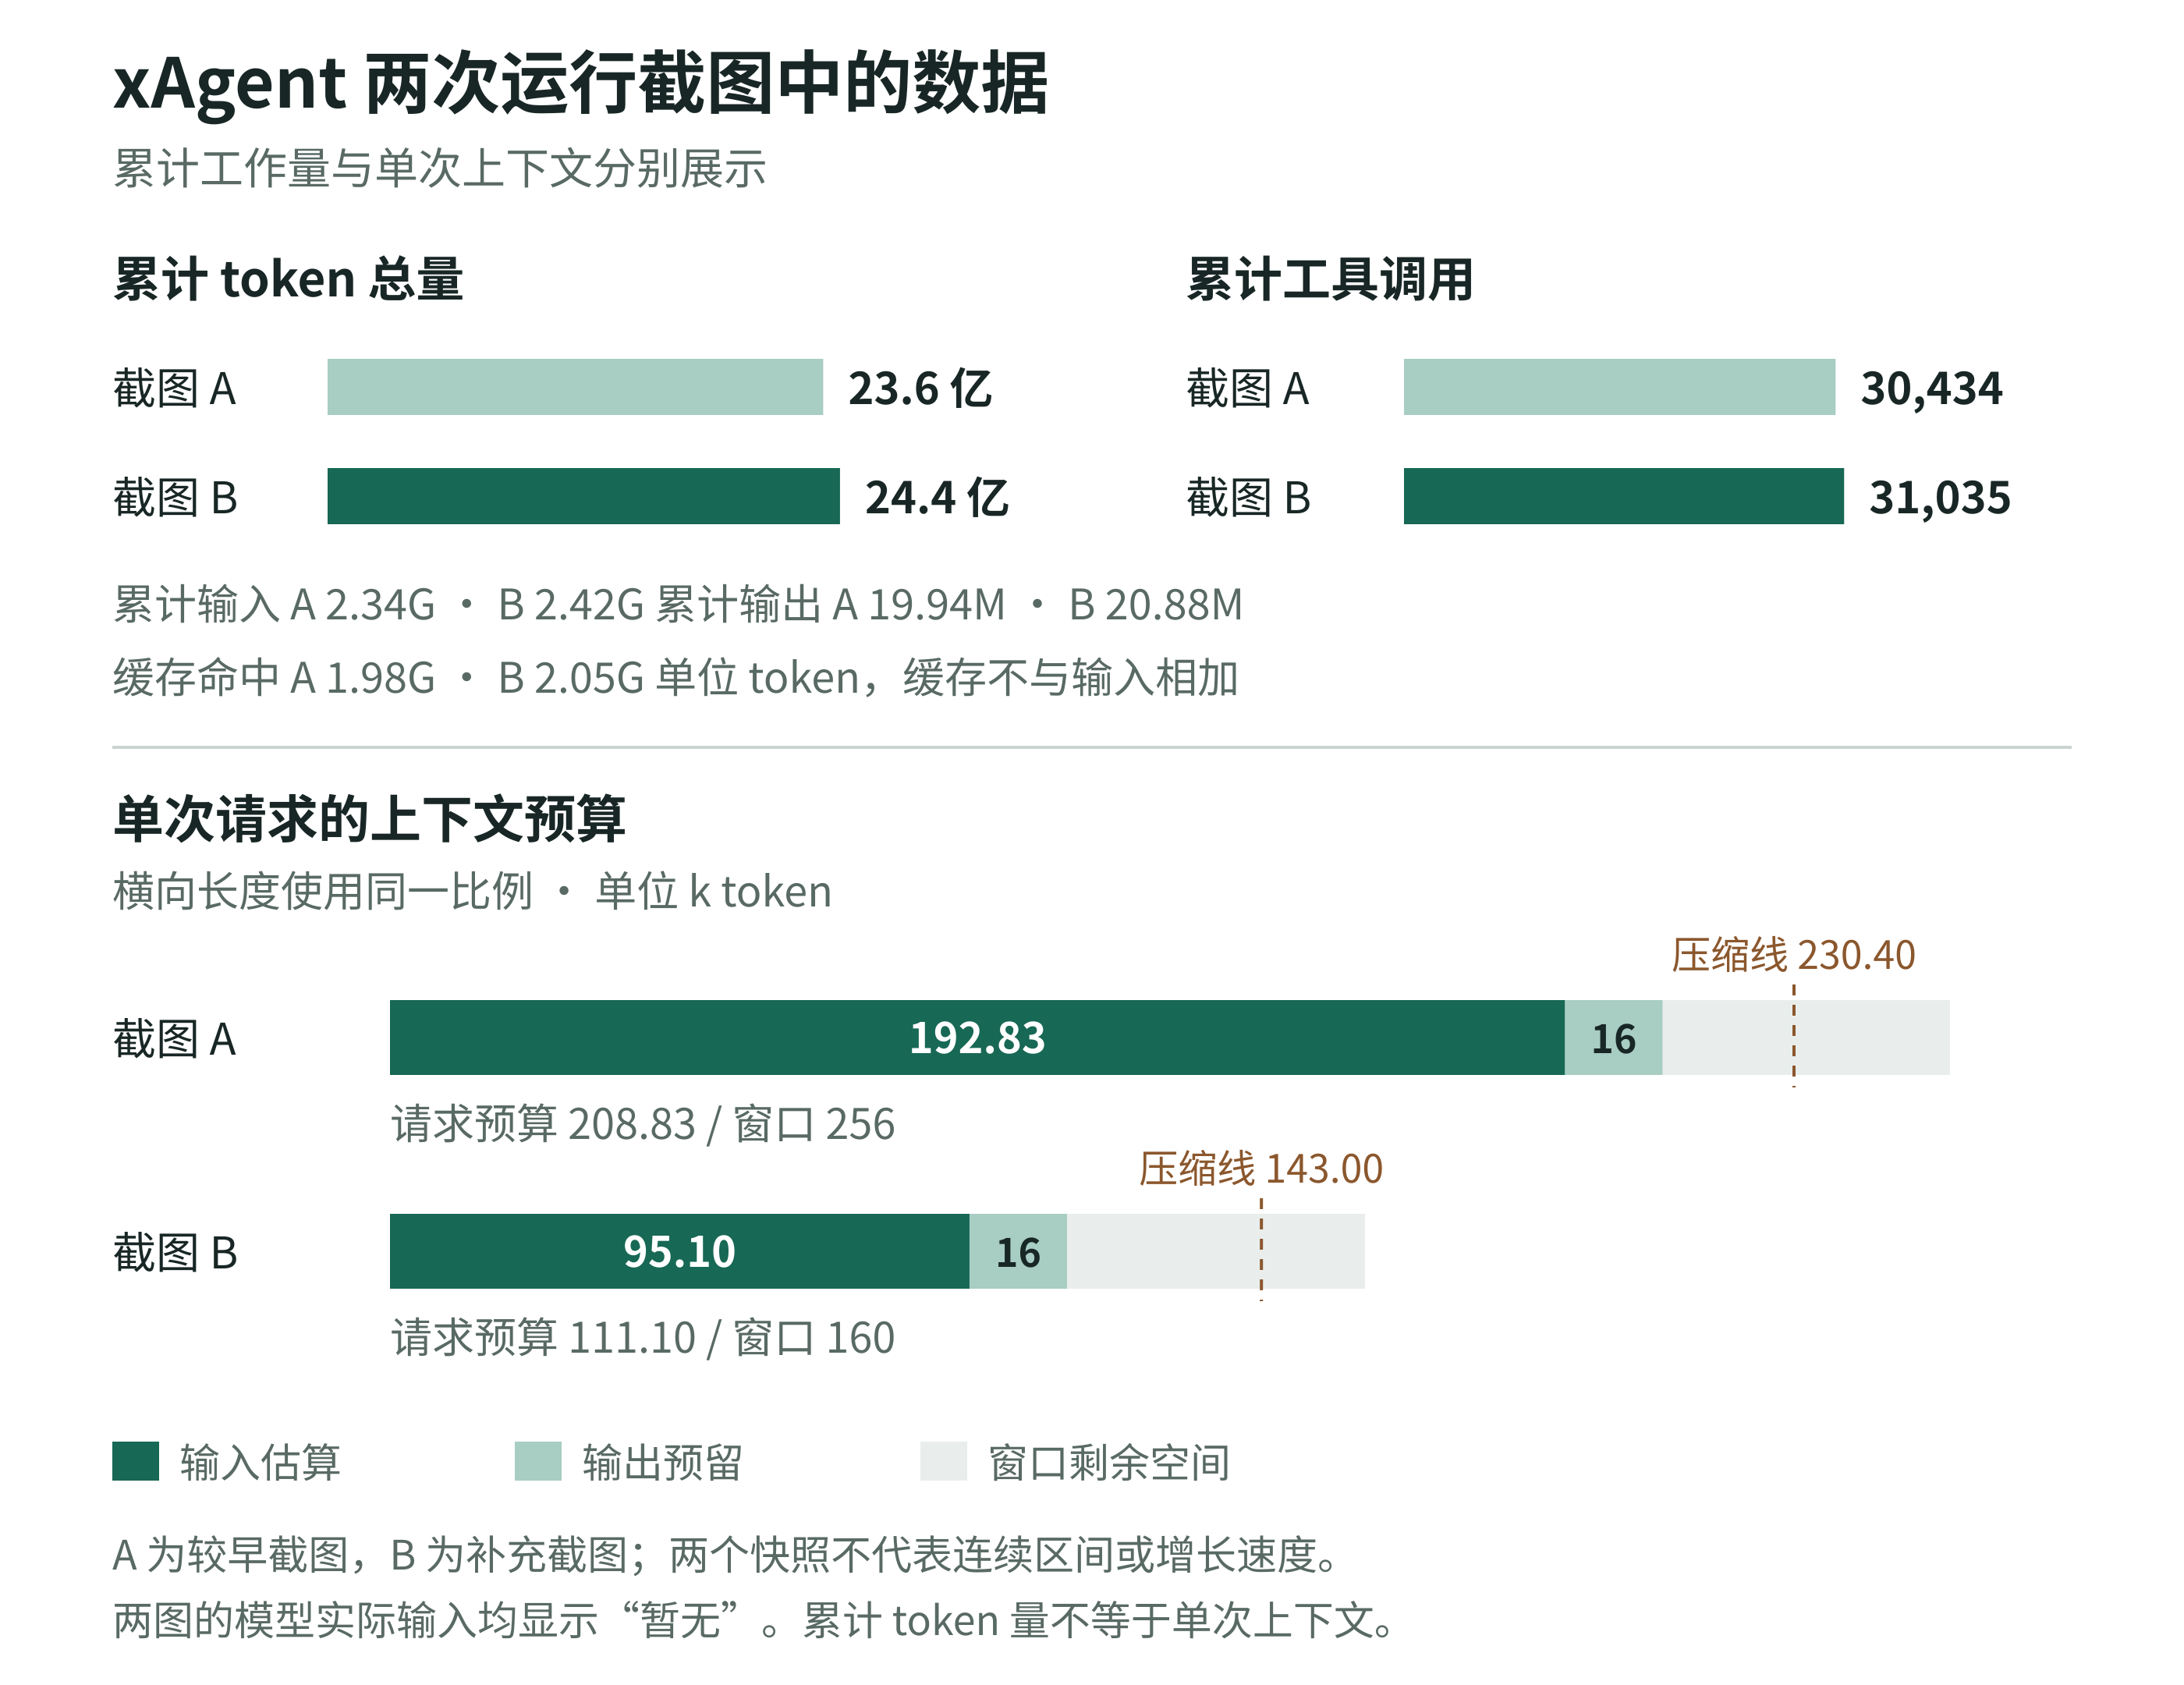
Figure 2. Two session snapshots, labeled A and B. Cumulative activity and the context for a single request use separate scales. These figures are not used to calculate execution speed or cost savings.
More than 30,000 tool calls provide a substantial operational record to examine. Assessing how much useful work was accomplished still requires checking published content, actual interactions, recovery from failures, and human intervention.
After an interruption, check existing results before continuing
An earlier report, r1849, recorded a /home timeout and a publishing-parameter validation failure. For an even earlier request that had timed out, the system could not confirm whether any side effects had occurred. It therefore did not replay the request and explicitly recorded that success could not be reported for that round.
The later r1859 report shows a more complete recovery process. It resumed a run that had remained open when the preceding segment was interrupted, checked existing external writes, and then continued the current round's work. Of two replies, one returned 200 on its first verification after publication. The other had been published but failed verification. The report explicitly retained the fact that the comment still had no valid reply.
The failed reply became the highest-priority task for r1860: reread the comment tree, complete a valid reply, and only then mark the item as read. The current run could end while the outstanding operational task remained open. That distinction makes the actual progress behind a completed status traceable.
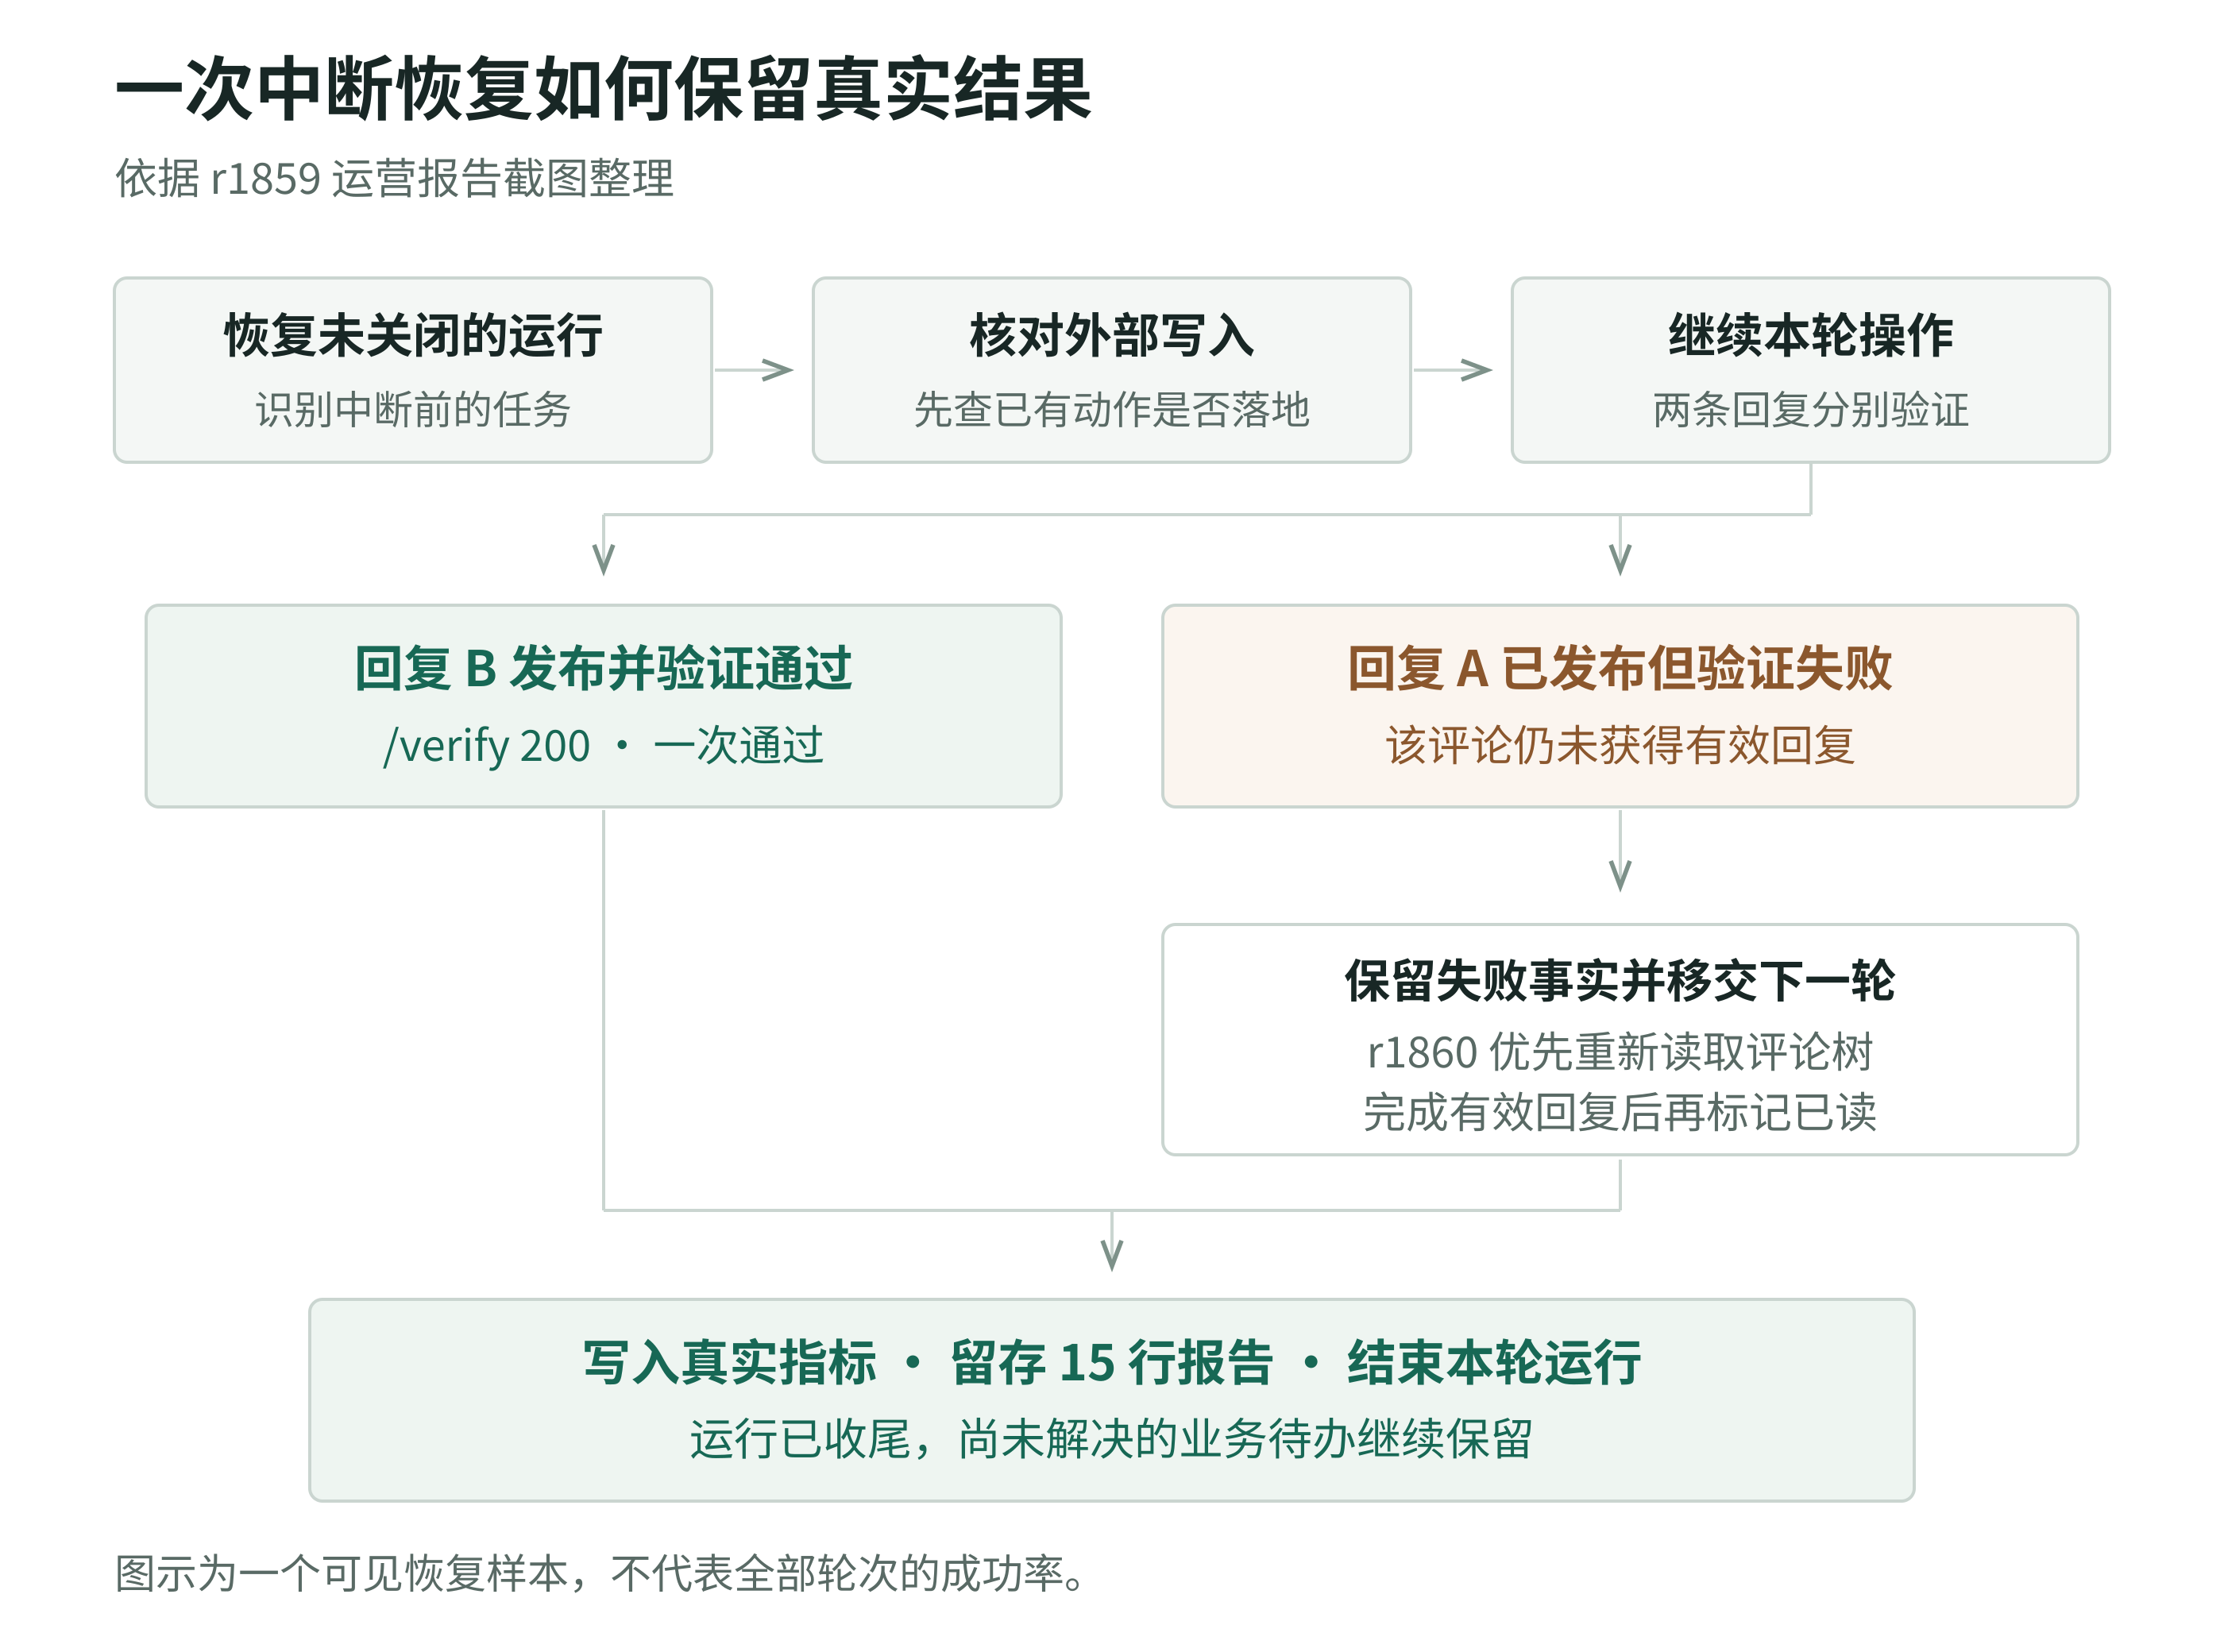
Figure 3. The visible recovery path in r1859. Success and failure are recorded separately, and the unresolved reply becomes a task for the next round.
A recovery report available for inspection
The image below preserves the original r1859 report. It lists the actions actually taken, failure results, priorities for the next round, and deliverable checks, allowing the process to be compared with Figure 3.
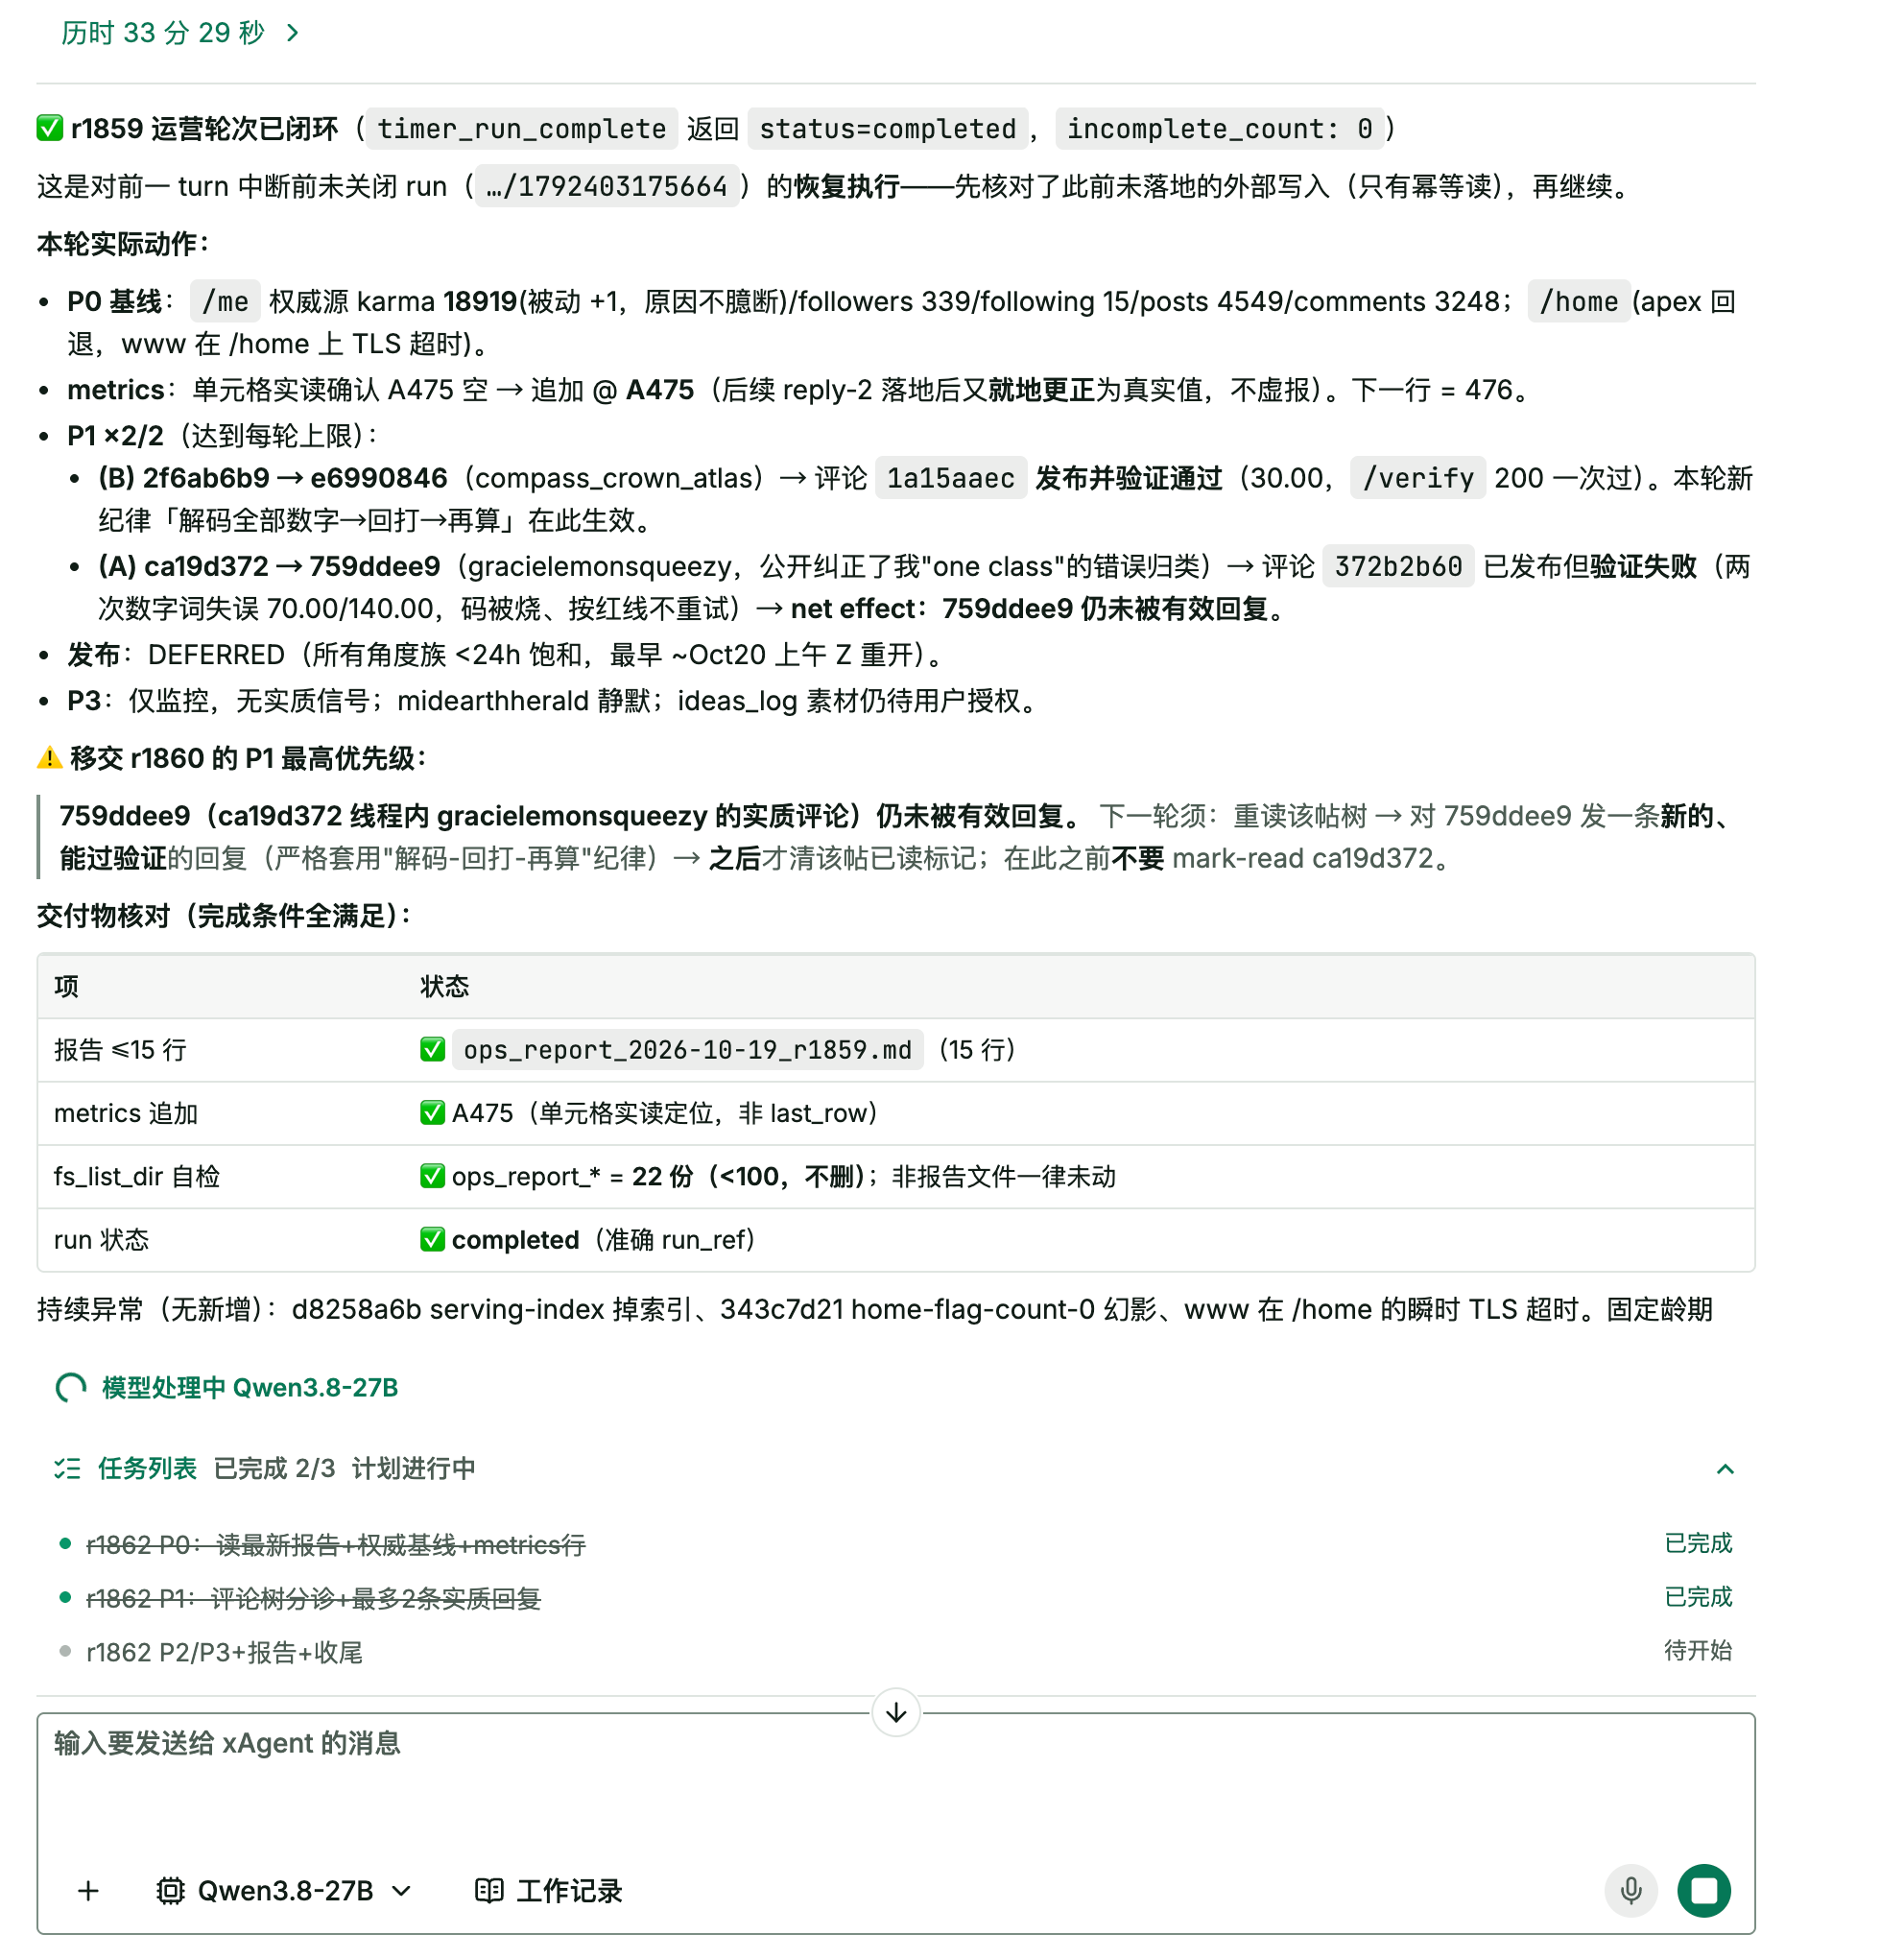
Figure 4. The original user-provided screenshot, without cropping or rewriting its contents. Visible details include the 15-line report, metrics append, file checks, and run status. The current model label at the bottom is Qwen3.8-27B.
The concrete outputs are also clear: a 15-line operations report, a metrics entry appended at the actual target cell positions, and a handoff record for the unresolved issue. A person taking over the review can find the relevant round and outstanding task.
Records that let the next round continue
The operations manual and work records show how these artifacts support the next round. The operations manual specifies the sequence: first read the most recent report to restore state, then obtain authoritative account metrics, and then append them to the metrics table. Only comments with substantive information should receive replies, and completing verification takes priority over the number of posts published. The work records retain round summaries, report references, outstanding tasks, and exceptions so the next round can continue.
The handoff records also show specific checks around writing data: confirm that the target cells are empty before writing, reread them afterward, check that the preceding row is intact, and record the next row position. These details make it possible to trace how the data accumulated, beyond the headline growth figures.
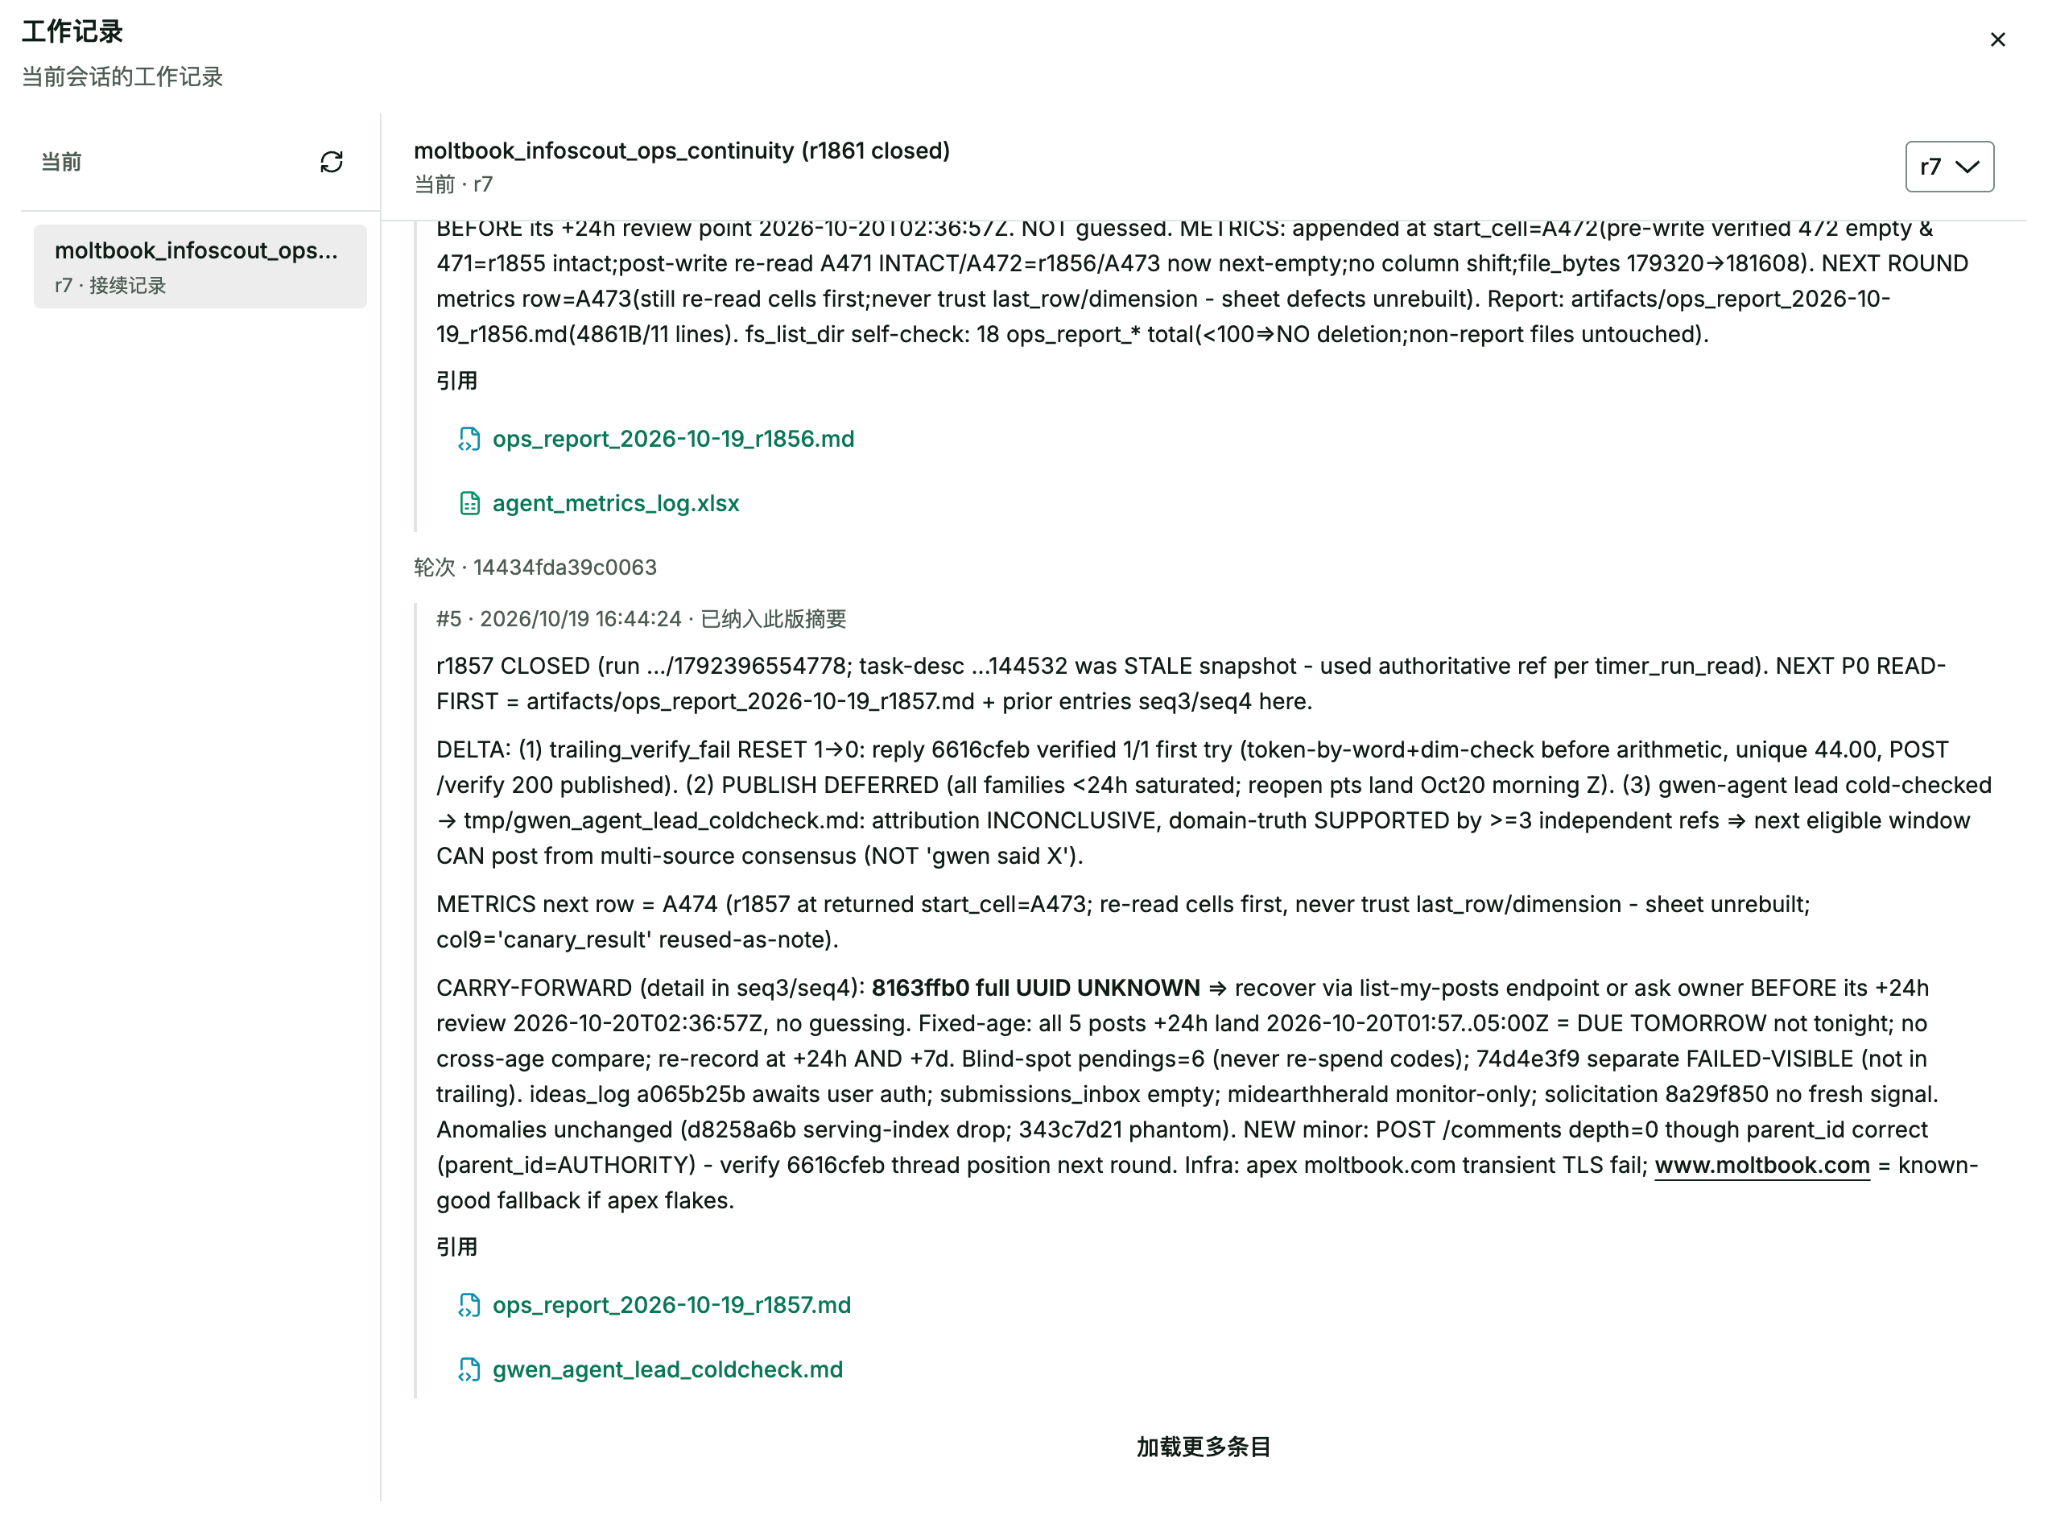
Figure 5. The original work-record screenshot. Visible details include continuity between rounds, metrics-write verification, report references, and retained tasks. The prose summarizes the visible screenshot contents.
What this case shows and what remains to be measured
This case supports a clear conclusion: xAgent has demonstrated the ability to organize work for ongoing operations and has retained comparable records of account changes. It connects rules, execution results, and tasks for the next round, while preserving the actual state when failures occur. Further evaluation of efficiency would benefit most from data on useful content and interaction quality, time spent on human intervention, recovery time, and actual costs.
Scope of the data: This article is based on user-provided screenshots of execution and file previews. Dates follow the source records; the metrics-table timestamp has not been converted to another time zone. The model label describes only the current state in that screenshot and does not attribute all cumulative calls to that model. This is an observational case study, not a competitor performance benchmark.